Power BI Training

Microsoft Power BI Training at Brainsmiths Labs will help you achieve expertise in business analytics. At the end of this course, you will master the concepts like Power BI Desktop, Power BI DAX, Power BI Q&A, Power BI Content packs, Power BI Custom Visuals, Power BI Integrations with Azure Machine Learning and SQL Services.

40 hours of In-depth sessions / Basic to Advanced level / In-depth hands-on classes

Top Reviews Corporates And Students


Our Top Expert Trainers

Want to discuss with Trainer?

Modes of Delivery

Curriculum

Learning Objective: This module will introduce you to Power BI, its building blocks and the various fundamental concepts of Power BI.

Topics:

  • Business Intelligence
  • Self Service Business Intelligence
  • SSBI Tools
  • What is Power BI
  • Why Power BI?
  • Key Benefits of Power BI
  • Flow of Power BI
  • Components of Power BI
  • Architecture of Power BI
  • Building Blocks of Power BI

Learning Objective: This module will introduce you to Power BI Desktop. You will know how to extract data from various sources and establish connections with Power BI Desktop, perform transformation operations on data and the Role of Query Editor in Power BI.

Topics:

  • Overview of Power BI Desktop
  • Data Sources in Power BI Desktop
  • Connecting to a data Sources
  • Query Editor in Power BI
  • Clean and Transform your data with Query Editor
  • Combining Data – Merging and Appending
  • Cleaning irregularly formatted data
  • Views in Power BI Desktop
  • Modelling Data
  • Manage Data Relationship
  • Cross Filter Direction
  • Create calculated tables and measures
  • Optimizing Data Models

Learning Objective: This module will help you learn the basics of DAX in Power BI Desktop.

Topics:

  • Essential concepts in DAX
  • Why is DAX important?
  • DAX Syntax
  • Data Types in DAX
  • Calculation Types
  • DAX Functions
  • Measures in DAX
  • DAX Operators
  • DAX tables and filtering
  • DAX queries
  • DAX Parameter Naming

Learning Objective: This module will help you understand the benefits and best practices of Data Visualization. It will also help you in creating charts using Custom Visuals.

Topics:

  • Introduction to visuals in Power BI
  • Charts in Power BI
  • Matrixes and tables
  • Slicers
  • Map Visualizations
  • Gauges and Single Number Cards
  • Modifying colors in charts and visuals
  • Shapes, text boxes, and images
  • What Are Custom Visuals?
  • Page layout and formatting
  • KPI Visuals
  • Z-Order

Learning Objective: This module will help you in creating Dashboards and publishing it on Power BI services. You will also be taught to monitor Real-time Data with REST API.

Topics:

  • Introduction to Power BI Service
  • Dashboard vs. Reports
  • Quick Insights in Power BI
  • Creating Dashboards
  • Configuring a Dashboard
  • Power BI Q&A
  • Ask questions of your data with natural language
  • Power BI embedded

Learning Objective: This module will help you learn, how to connect data sources directly to Azure, HD Spark, My SQL, and create interactive dashboards.

Topics:

  • Introduction to using Excel data in Power BI
  • Exploring live connections to data with Power BI
  • Connecting directly to SQL Azure, HD Spark, SQL Server Analysis Services/ My SQL
  • Introduction to Power BI Development API
  • Import Power View and Power Pivot to Power BI
  • Power BI Publisher for Excel
  • Content packs
  • Introducing Power BI Mobile

Learning Objective:This module will help you understand about Power BI Report Servers and data gateways. Also, you will learn about the web portal in which you display and manage reports and KPI’s.

Topics:

  • Report Server Basics
  • Web Portal
  • Web Portal
  • Row level Security
  • Data Gateways
  • Scheduled Refresh
  • Resources (Rest API/ SOAP API’s/ URL Access)

Learning Objective: This module will help you create R and Python visuals in Power BI Desktop as well as in Power BI Service.

Topics:

  • R Integration in Power BI Desktop
  • R visuals in Power BI
  • R Powered Custom Visuals
  • Creating R visuals in Power BI
  • R Visuals in Power BI Service
  • R Scripts Security
  • Creating visual using Python

Frequently Asked Question

Your access to the Support Team is for lifetime and will be available 24/7. The team will help you in resolving queries, during and after the course.

You will never miss a lecture at Brainsmiths Labs. You can choose either of the two options:

  • View the recorded session of the class available in your LMS.
  • You can attend the missed session, in any other live batch.

Post-enrolment, the LMS access will be instantly provided to you and will be available for lifetime. You will be able to access the complete set of previous class recordings, PPTs, PDFs, assignments. Moreover the access to our 24x7 support team will be granted instantly as well. You can start learning right away.

Yes, the access to the course material will be available for lifetime once you have enrolled into the course.

How we can help you

+1 (818) 284-6556

Top Blogs

Python in a Nutshell

Python in a Nutshell: Everything That You Need to Know

Read more
Guide to Node.js

The Ultimate Guide to Node.js

Read more
Power BI Training

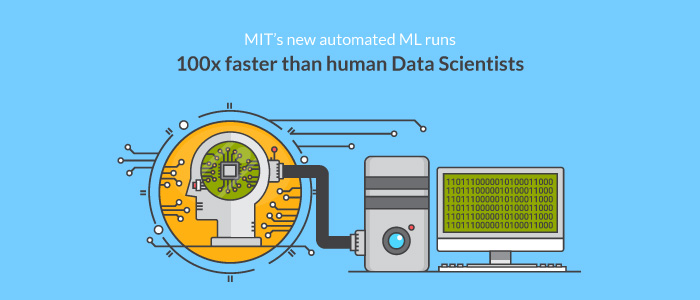
MIT’s new automated ML runs 100x faster than human Data Scientists

Read more

RELATED TRAINING